Slow websites lose money. Before you rewrite your frontend or throw hardware at the problem, there's one thing you should always check first — and it's not what most developers think.
Someone asked me this the other day: "What's the first thing you check when a website isn't performing well?"
My answer surprised them. It's not the bundle size. It's not the server response time. It's not even the database queries.
It's the network tab.
Open DevTools, click Network, reload the page, and just look. The answer is almost always staring right at you — you just have to know what to look for.
01Why the Network Tab First?
Because performance problems are almost never where developers think they are. Teams will spend weeks optimizing React renders or adding memoization when the real bottleneck is a 2MB hero image, 47 render-blocking scripts, or an API call that takes 4 seconds because it's fetching data the page doesn't even use.
The network tab gives you the full picture in 10 seconds. Everything else is a guess.
Here's what I'm looking for, in order:
021. The Waterfall
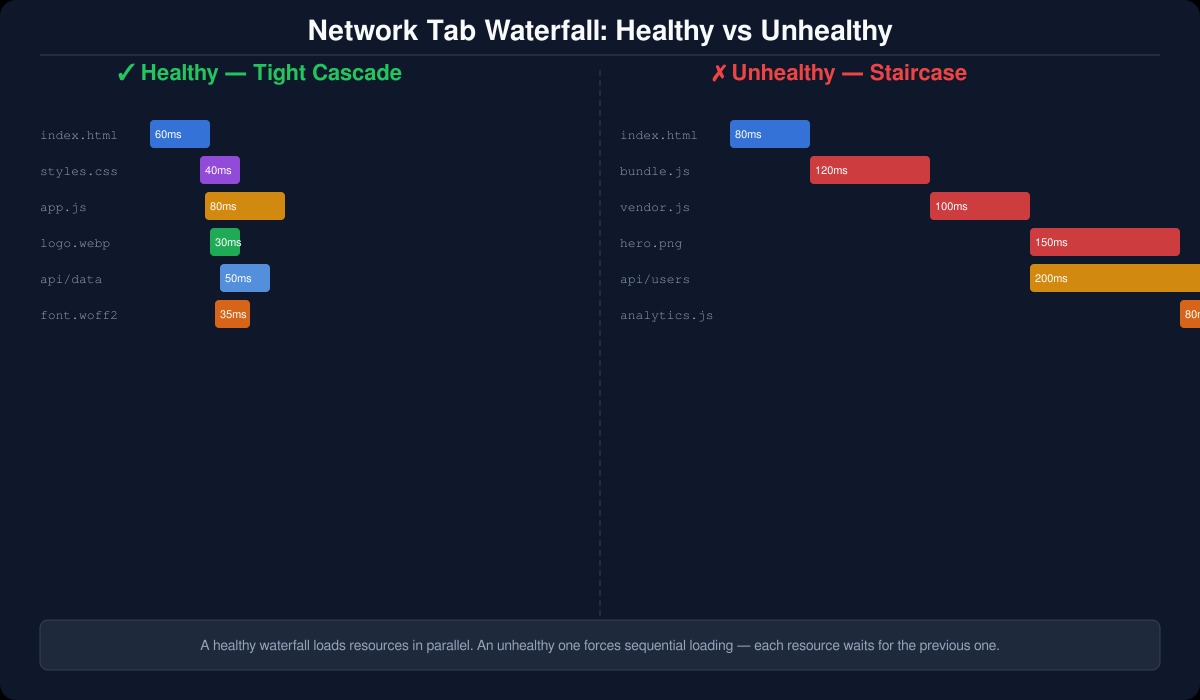
The waterfall visualization shows you when each resource loads relative to everything else. You're looking for:
- Long horizontal bars — something is taking too long
- Gaps between bars — the browser is waiting when it shouldn't be
- Late-loading critical resources — fonts, above-the-fold images, or API data that doesn't start loading until JavaScript executes
The waterfall tells a story. A healthy page looks like a tight, front-loaded cascade. An unhealthy page looks like a staircase — each resource waiting for the previous one to finish before it even starts.
032. Unnecessary Requests
Count the requests. A marketing page making 80+ network requests has a problem, no matter how fast each individual request is.
Common offenders:
- Analytics scripts loading analytics scripts loading more analytics scripts
- Third-party widgets you added "temporarily" two years ago
- API calls that fetch entire datasets when the page only needs a count
- Fonts you're loading but never rendering (looking at you, font-display: swap with 6 weights)
Every request is a round trip. Every round trip is latency. Kill the ones that don't earn their keep.
043. Payload Sizes
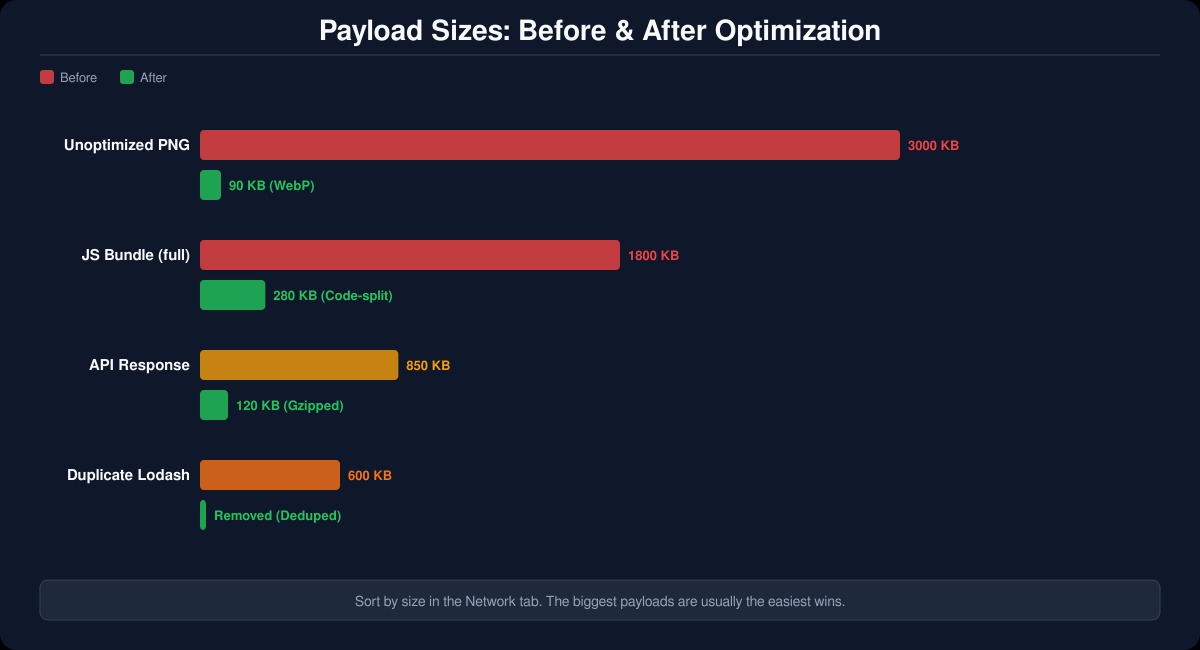
Sort by size, largest first. You'll usually find:
- Unoptimized images — a 3MB PNG that should be a 90KB WebP
- Uncompressed API responses — JSON payloads that aren't gzipped
- JavaScript bundles — shipping your entire node_modules to the browser
- Duplicate libraries — two versions of lodash because nobody audited the dependency tree
The fix for each of these is straightforward, but you can't fix what you can't see. The network tab shows you exactly where the bytes are going.
054. Caching Headers
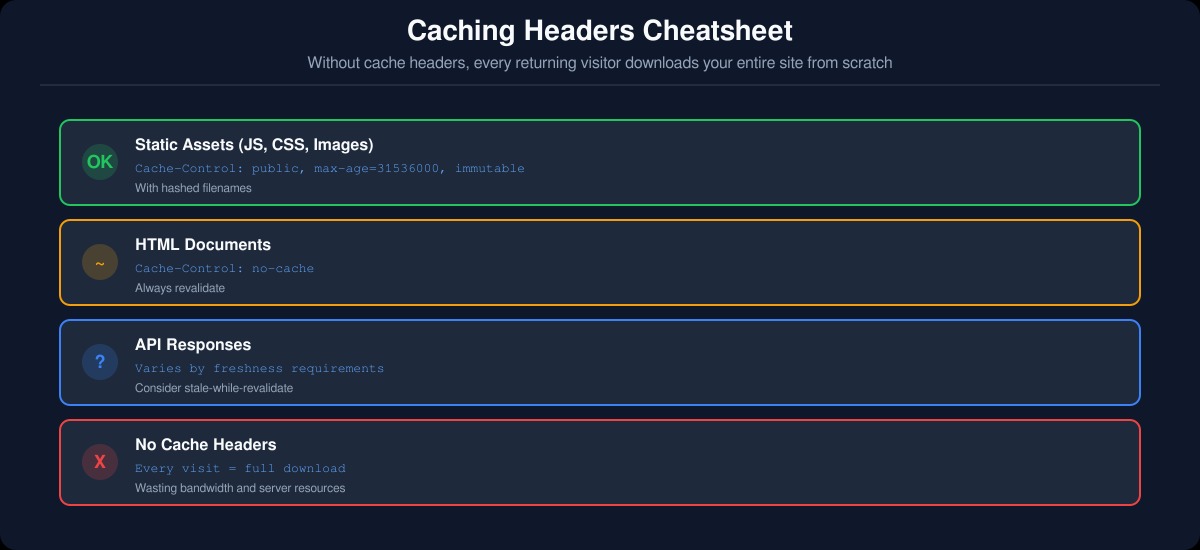
Click on any resource and check the response headers. You're looking for Cache-Control, ETag, and Expires.
If your static assets don't have cache headers, every returning visitor is downloading your entire site from scratch. That's not a performance problem — it's a respect problem. You're wasting your users' bandwidth and your own server resources.
A good baseline:
- Static assets (JS, CSS, images):
Cache-Control: public, max-age=31536000, immutable(with hashed filenames) - HTML:
Cache-Control: no-cache(always revalidate) - API responses: depends on your data freshness requirements
065. Third-Party Scripts
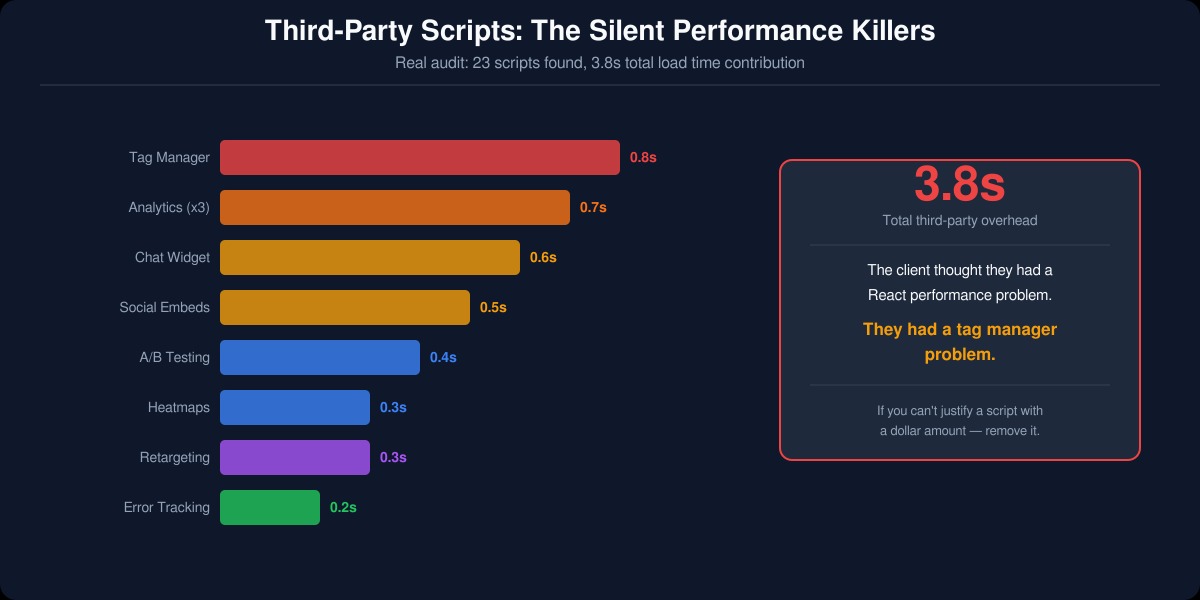
Filter the network tab by "third-party" and count what you see. Every third-party script is code you don't control running on your page.
We audited a client's site last month and found 23 third-party scripts. Total load time contribution: 3.8 seconds. The client thought they had a React performance problem. They had a tag manager problem.
Third-party scripts are the silent killers of web performance. They load late, they block rendering, they phone home to slow servers, and nobody owns them internally. If you can't justify a script's presence with a dollar amount, remove it.
07What I Don't Check First
Notice what's not on this list:
- React profiler — component render times are almost never the bottleneck for perceived performance
- Lighthouse score — useful as a checklist, terrible as a diagnostic tool
- Server-side metrics — important, but if the problem is visible to users, start where users are: the browser
- Core Web Vitals — they'll tell you that something is wrong, but not why
These tools have their place, but they're step 2. Step 1 is always the network tab. It's faster, more visual, and catches the problems that actually matter to users.
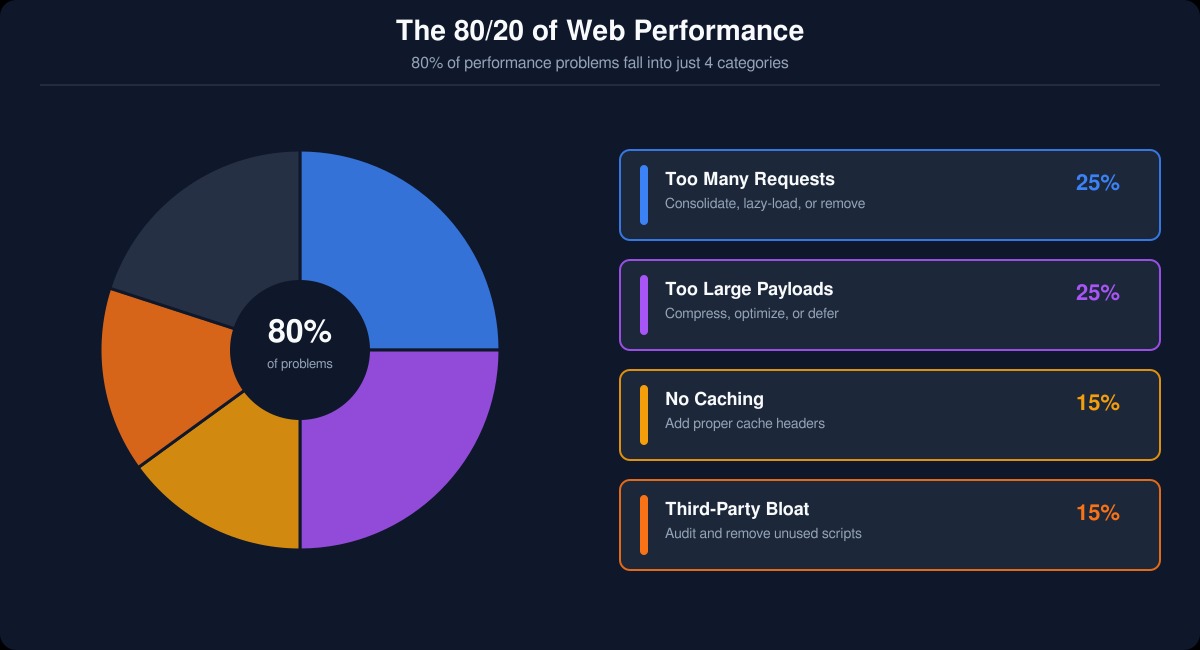
08The 80/20 of Web Performance
In my experience at Apptivity, 80% of web performance problems fall into four categories:
- Too many requests — consolidate, lazy-load, or remove
- Too large payloads — compress, optimize, or defer
- No caching — add proper cache headers
- Third-party bloat — audit and remove
None of these require a rewrite. None of these require new infrastructure. They require someone to open the network tab and actually look.
09The Bottom Line
Before you reach for a profiler, before you open a monitoring dashboard, before you start debating whether to switch frameworks — open the network tab. Reload the page. Sort by size. Read the waterfall.
The answer is usually right there. And the fix is usually simpler than you think.
If your site is slow and you're not sure where to start, we do 30-minute performance audits at Apptivity. No commitment, no pitch deck — just someone who's done this a thousand times looking at your network tab with you.